The Client
A DTC Shopify brand selling Tibetan herbal incense rooted in centuries-old heritage — wild-harvested Himalayan herbs with a portion of every order donated to Tibetan education. The previous agency was terminated with all campaigns running below 1× ROAS. Gross margin: ~50%. Geography: 75% US sessions / 96% US revenue; UK, Canada, Australia secondary.
This is the exact trigger event our ICP research names — CVR plateau after ad-agency failure. What this client did next was start with a diagnostic before signing anything else. That’s how we run every engagement.
The Challenge — Where Conversion Stood
Before the audit, the store converted at 0.9% (Shopify Analytics, 29 January to 28 February 2026).
The Strategy & Methodology — 5-Phase Audit
- Meta Ads Audit — account health, creative analysis, ROAS diagnosis.
- UX Audit — Microsoft Clarity qualitative analysis across 2,787 sessions.
- Tracking Audit — GTM container, GA4 configuration, ecommerce events.
- UX Recommendations — page redesign specs, 104-item design checklist.
- CRO Recommendations — funnel optimization, email audit, inventory strategy.
Tool Stack: Microsoft Clarity, Google Tag Manager, GA4, Shopify Analytics, Meta Ads Manager, Klaviyo.
5 critical discoveries
- Tracking was lying. The GTM add-to-cart trigger fired on page_view (URL contained /cart) — not on button click. GA4 showed 181 phantom “purchases” vs ~20 actual orders — a 9× discrepancy. GTM container rebuilt from scratch.
- Sold-out killing 47% of ATC intent. 29 of 62 ATC-intent sessions (47%) hit a sold-out product; 157 total clicks into sold-out inventory. “Inventory before CRO” applied.
- Email machine broken. Spam-report rate 0.5% (benchmark <0.08%); abandoned-checkout CTA click rate 0%; browse-abandonment flow in draft, never activated in 12 months; $814 total email revenue in 12 months.
- Ads hemorrhaging at 0.97× ROAS. $1,887 spend over 60 days, 20 purchases. At 50% margin: −$0.51 lost per $1 spent. Break-even required: 2.0×.
- Mobile scroll depth 25.42%. Mobile = 69% of traffic but only 25.42% avg scroll depth (desktop 40.97%); 274 dead clicks, 197 quick-backs.
The Result: 0.9% to 2.4% conversion rate
Within 14 days of the fixes going live (the rebuilt tracking and the sold-out inventory fix among them), Lhasa Remedy’s conversion rate rose from 0.9% to 2.4%, an increase of 167%. The two Shopify Analytics views below come from the store’s own admin, all channels.
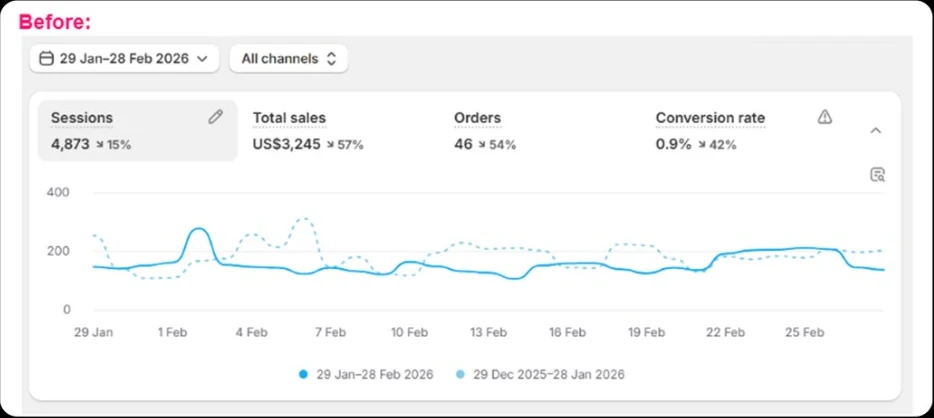
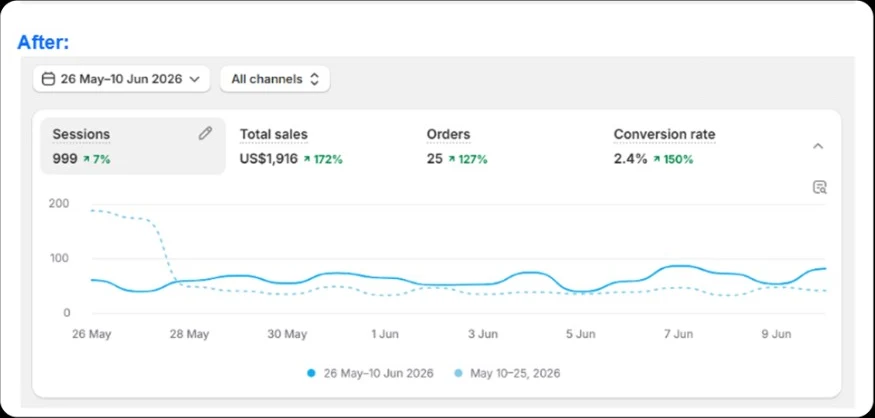
Source: Shopify Analytics, all channels. Conversion rate is the share of sessions that ended in a purchase, as Shopify Analytics reports it. The two periods are different lengths (30 and 16 days). The percentages shown inside each screenshot compare that period with the one just before it, not with the other screenshot.
The Results — From Audit to Fixes
| Area | Before Audit | After Audit |
|---|---|---|
| CVR | 0.9% (Shopify Analytics, 29 Jan to 28 Feb 2026) | 2.4% (Shopify Analytics, 26 May to 10 Jun 2026) |
| Tracking | 9× discrepancy | GTM rebuilt — discrepancy eliminated |
| $814 in 12 months; 0.5% spam | Audit delivered — fixes specified | |
| Ads | 0.97× ROAS; −$0.51/$1 loss | Restructured — catalog retargeting reactivated |
| Design | Round 1: 30% compliance | Round 2: major improvements |
Why It Worked (as a diagnostic)
- 5-phase coverage eliminated the “fix one thing, miss the root cause” trap.
- Tracking fix first — no optimization is valid on broken data.
- Sold-out discovery exposed that UX wasn’t the conversion killer — inventory was.
- The email channel had 12 months of dormant revenue sitting in draft folders.
Key Takeaways
- Never optimize conversion on broken tracking — you’re optimizing a hallucination.
- Inventory IS the funnel — 47% of ATC intent hitting sold-out is a supply-chain crisis.
- Email is the highest-ROI channel you’re ignoring.
- 0.97× ROAS with 50% margins means paying to acquire customers at a loss.
- A 5-phase audit takes longer but costs less than 12 months of bleeding ad spend.